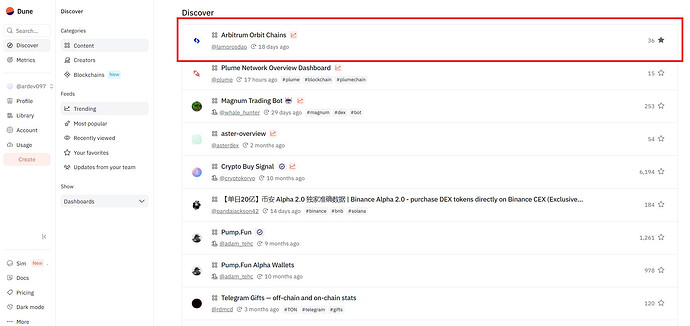
With the rise of Arbitrum Orbit Chains, there has been no unified way to track their on-chain activity in real time. We built this dune dashboard to fill that gap, offering clear, comparative insights into how these chains are being utilised, who is deploying on them, and how their ecosystems are evolving.
About Us and Why We Built This
We are Lampros DAO, an open-community collective focused on development, research, governance, and educational initiatives within the Arbitrum ecosystem. We contribute through protocol development, data analysis, governance participation, and public educational initiatives.
As Arbitrum Orbit Chains began to launch and scale, we noticed the growing need for real-time, transparent, and comparable data on their usage, performance, and growth dynamics. Our motivation came from a simple gap: Orbit chains are growing fast, but the data needed to understand their real usage and performance is still scattered or siloed, so we built a Dune dashboard to monitor and evaluate them, starting with the ones already indexed on Dune.
Orbit Chains Currently Tracked (for now)
The dashboard currently includes:
We aim to expand this list based on feedback from the community and as more Orbit chains become indexable on the Dune Analytics platform.
What’s Inside the Dashboard
The dashboard is structured around six core sections, each capturing specific dimensions of Orbit chain activity. Below are some of the key metrics included. This is not an exhaustive list, so we encourage you to explore the full dashboard to view additional insights.
Transaction Performance Metrics
- Transactions per second (TPS)
- Daily transaction and success/failure breakdown
- Total transaction counts (24h, 7d, 30d, all-time)
- Peak activity hours and transaction load per user
Gas and Block Metrics
- Total transaction fees (ETH)
- Daily and per-transaction gas fees in USD
- Block size and gas limit behaviour
- Gas usage by action type (contract calls vs native transfers)
Contract Metrics
- Top-deployed contracts and function calls
- Contract deployer rankings and activity timelines
- New vs returning contracts over time
- Contracts frequently interacted with by new users
User Activity Metrics
- Daily, weekly, and monthly active users
- User retention cohorts (1 to 6 weeks)
- New vs recurring addresses and usage depth
- Distribution of addresses by transaction frequency
Total Value Locked (TVL)
- Daily changes in chain-level TVL in USD
Tokenomics
- Top NFT collections by volume, transfers, and holders
- ERC20 vs ERC721 activity (users and transfers)
- Most traded tokens by new users
These metrics are visualized per chain and updated regularly, enabling detailed tracking of adoption and operational dynamics.
Who Can Benefit From This Dashboard
This dashboard is designed as a decision-making tool for a range of stakeholders engaging with Arbitrum and its Orbit chains:
- Delegates and Governance Participants
Use real-time metrics on activity, adoption, and contract usage to assess the impact of grant programs, DAO-funded projects, and ecosystem health for decision making and voting. - Developers and Builders
Track gas conditions, deployment patterns, and user retention to optimize contract design, improve onboarding, and benchmark dApp engagement across chains. - Chain Teams and Orbit Operators
Monitor chain performance through TPS, gas fees, and TVL. Compare with peers to identify growth opportunities, UX bottlenecks, or ecosystem gaps. - Power Users and DAOs
Evaluate chain liveliness, fees, and user activity before interacting or deploying liquidity. Use on-chain trends to guide strategy or participation. - Analysts and Researchers
Access a public, real-time data layer for studying user behaviour, contract dynamics, and protocol evolution. Supports reporting, impact tracking, and ecosystem research.
This dashboard is an ongoing initiative, and we’re continuously working to improve it.
Explore the Dashboard
Here’s the link to the dashboard - Arbitrum Orbit Chains Dashboard by Lampros DAO.
Share Your Feedback or Request a Chain
As small but active delegates in the Arbitrum DAO, we’re committed to contributing in ways that align with our strengths. Data analysis, tooling, and ecosystem research are areas where we bring the most value, and this dashboard is part of that ongoing effort.
We’d love to hear from you:
- Are there additional metrics you’d like to see?
- Is there a specific Orbit chain you want us to include?
- Any improvements in how the data is presented?
If you’re part of an Orbit chain team and would like to see your chain added, feel free to reach out to me or Chain_L.
Also, if you find this dashboard useful, we’d appreciate it if you could give it a star on Dune and help spread the word. Feel free to share it on socials, include it in your research, or reference it in your yapping campaign, so more people in the ecosystem can benefit from these insights.

