Introduction
Decentralized Autonomous Organizations (DAOs) promise a new model of governance, one operated by a community without centralized control. In practice, however, many token-based voting systems risk recreating the very centralization they seek to avoid. Decision-making can be dominated by a small number of large holders, or “whales,” disproportionately skewing outcomes. This challenge is particularly nuanced in systems like Arbitrum DAO, which use a delegation model. This model creates a critical distinction between two layers of governance power:
-
Potential Power: The potential influence held by delegates based on the total ARB tokens
delegated to them. -
Actual Power: The actual power exercised by these delegates when they cast votes on specific proposals. Decentralization is not a binary state but a spectrum.
Understanding where Arbitrum DAO sits on this spectrum requires moving beyond surface-level observations to a quantitative analysis of both potential and actual power distribution. This report provides a quantitative assessment of decentralization in Arbitrum DAO by analyzing
these two distinct layers: the Delegated Voting Power Layer and the Proposal Voting Layer. To measure the concentration of power in each, we employ two established economic metrics: the Gini Coefficient, to assess overall distribution inequality, and the Herfindahl-Hirschman Index (HHI), to measure voting power concentration and the influence of the largest actors.
Our goal is to provide the Arbitrum community and the broader DAO ecosystem with empirical
tools to identify concentration trends, assess the impact of its delegation system, and strengthen
long-term protocol health.
Motivation
Arbitrum has become one of the most active DAOs in the ecosystem, managing a multibillion-dollar treasury and supporting thousands of delegates and contributors. With that scale, governance legitimacy becomes increasingly important.
Recent participation trends reveal a paradox. Voter numbers have grown significantly, but effective influence is still concentrated in a small group of large holders. This is not unique to Arbitrum. It is common in DAOs as they scale. But it highlights the need to examine distribution more closely.
The purpose of this report is not to criticize. It is to bring transparency. By applying standard decentralization metrics, we aim to provide a shared frame of reference for the community. With clearer data, delegates and builders can see where participation is broad, where it is narrow, and where risks of over-centralization may arise..
Selection of Metrics
While all four metrics reviewed in Section 2 provide value, they answer different questions. For our analysis of Arbitrum DAO’s two-layer governance—that is, the concentration of potential power among all delegates versus the concentration of actual power cast in proposals—we have selected the Gini Coefficient and the Herfindahl–Hirschman Index (HHI).
Quantitative Analysis
Decentralization Analysis on Arbitrum (Delegated Voting Power Layer)
To keep the analysis robust and manageable, we focus on the top 20,000 addresses ranked by voting power. This excludes the long tail of holders with negligible influence on governance outcomes.

Figure 1: Distribution and Temporal Dynamics of Voting Power in DAO Governance
Figure 1 shows a highly skewed distribution of voting power per address, with a long right tail indicating strong concentration among a few large holders—likely venture funds, Arbitrum-aligned entities, and established delegates—each controlling tens of millions of tokens.
Over time, the number of addresses with voting power increased steadily from around 40 K to 170 K between early and late 2023, reflecting growth in onboarding and engagement. From late 2024 onward, participation declined to roughly 220 K by mid-2025, likely due to small holders exiting and some delegates reducing holdings after ARB’s February 2024 ATH.

Figure 2: Daily Gini Coefficient and Delegate Composition in Arbitrum DAO
The figure 1 & 2 illustrate the inequality of total voting power distribution across all delegates, essentially, how evenly power is spread throughout the DAO. The bottom graph breaks this down by showing who holds that power — whales, mids, or small delegates — and how this composition evolves over time.
Voting Power Tiers
- Small: < 100K tokens
- Mid: 100K–1M tokens
- Whale: > 1M tokens
Shifts in Delegate Voting Power Concentration
- Early 2023 (April–June):
The Gini coefficient starts relatively low (~0.75) but quickly spikes toward 0.90+. Although the majority of delegates were small holders, whales already commanded most of the voting power (rising from 43.4% to 46.7%). This early concentration stemmed from the airdrop phase, where the claim interface prominently suggested delegating to well-known addresses. As a result, large holders rapidly consolidated control while many small holders remained underrepresented. - Mid to Late 2023:
The Gini coefficient continues its steep climb, from 0.83 to 0.90–0.95. Major delegates — such as TreasureDAO, L2BEAT, Griff Green, and other key contributors — collectively gained around 83 million ARB during this phase. The data confirms that new delegations increasingly flowed toward a handful of dominant addresses, marking a clear consolidation period across the DAO. - 2024 Onward:
The Gini gradually approaches 0.96–0.97 and stabilizes near that level. Whales now hold between 83% and 87% of all voting power, reflecting a saturated state of concentration. The number of active delegates declines slowly, suggesting that while overall inequality remains high, further consolidation occurs at a diminishing pace.
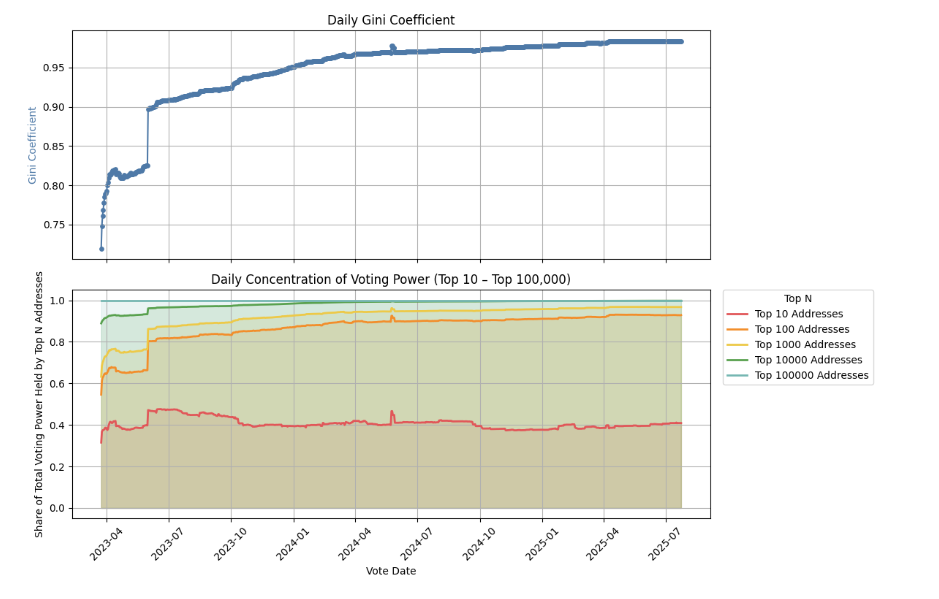
Figure 3: Daily Gini Coefficient and Top N Voting Power in Arbitrum DAO Governance
Figure 3 shows that voting power remains highly concentrated: the top 10 addresses control nearly 50% of all influence, the top 100 hold 60–85%, and power beyond the top 1,000 addresses flattens, contributing little to overall weight.
The Gini coefficient supports this pattern. In early 2023, power was more distributed (top 10 ≈ 30%, top 1,000 ≈ 60%), but by mid-2023 concentration surged, pushing the Gini toward 0.97. From 2024 onward, the distribution stabilized at this level, with large delegates retaining control. By 2025, new entrants like Entropy and LobbyFi slightly diversified holdings but did not meaningfully reduce overall centralization.
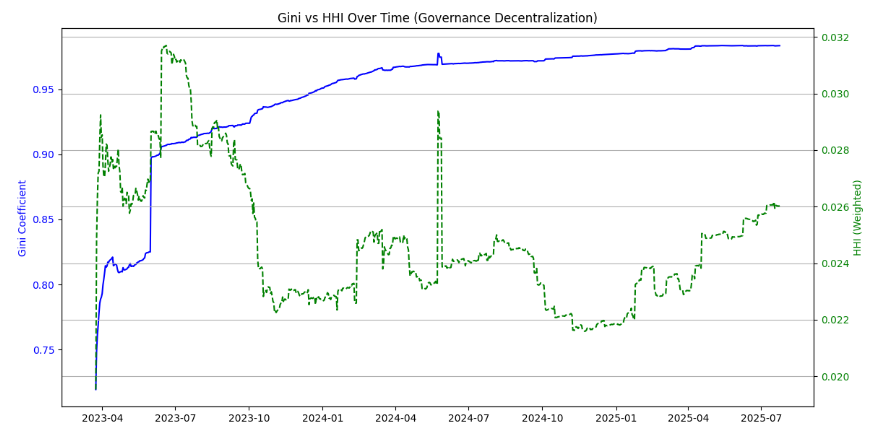
Figure 4: Temporal Dynamics of Gini Coefficient and Herfindahl–Hirschman Index (HHI) in Arbitrum DAO Governance
Figure 4 highlights the evolving structure of Arbitrum’s Delegated Voting Power Layer. The divergence between the Gini coefficient and HHI shows that inequality remains consistently high while concentration fluctuates, revealing that high inequality does not always imply high concentration.
Four phases define this evolution:
Early 2023 – Launch Phase: Delegate participation expanded rapidly. Whale delegates increased from ~15 to 30–35, and their collective power jumped from 43% → 70%. Both Gini and HHI rose, reflecting rapid centralization.
Late 2023 – Redistribution Phase: The Gini stabilized at a high level, but HHI fell (0.03 → 0.022) as whale numbers grew (~50) and power spread more evenly among them. Inequality persisted, yet dominance of “super-whales” eased slightly.
2024 – Stabilization Phase: Delegate composition and power shares plateaued. Whales maintained ~83% control, with Gini (~0.97) and HHI (~0.022) steady—signaling a stable but unequal equilibrium.
2025 – Re-centralization Phase: As mid- and small-tier delegates declined, relative whale influence rose again, lifting HHI while Gini stayed at its peak. The system entered a renewed phase of re-centralization driven by shrinking delegate diversity.
Decentralization Analysis on Arbitrum (Proposal Voting Layer)
We evaluate the decentralization of voting power in the Arbitrum ecosystem, we analyzed the Gini
coefficient across 66 governance proposals (abbreviation of proposal denoted P001 through P066).

Figure 5: Gini Coefficient by Proposal and Distribution of Voter with Their Respective Voting Power Share per Proposal
- The top panel reports per-proposal Gini coefficients, ordered by proposal end date. Values remain consistently high (0.994–0.999), indicating extreme and persistent concentration of voting power. Minor dips occur intermittently but do not alter the overall inequality trend.
- The bottom panel shows the composition of voters. While the number of participating addresses varies widely, whales consistently control the majority of voting power. Small delegates represent most participants but contribute little to total influence.
Findings
- Voting inequality is driven by power concentration, not participation levels.
- Temporary reductions in whale dominance marginally improve decentralization but do not meaningfully lower inequality.
- Structural concentration persists, as changes among whale, mid, or small tiers have negligible effects on overall Gini values.

Figure 6: Herfindahl-Hirschman Index (HHI) and Total Voting Power by Proposal (Sorted by End
Date)
We interpret the normalized Herfindahl–Hirschman Index (HHI) as follows:
- HHI < 0.15 (Broadly Distributed): Voting power is widely dispersed among participants.
- HHI 0.15–0.25 (Moderately Concentrated): A few dominant blocs begin to exert measurable influence.
- HHI > 0.25 (Highly Concentrated): A small, coordinated group of whales likely holds decisive control.
Across proposals, the HHI generally fluctuates between 0.15 and 0.25, indicating a moderate level of concentration. This suggests governance outcomes are typically shaped by competition among several large blocs rather than unilateral control. Occasional spikes above 0.25 mark proposals where a few aligned whales temporarily dominated voting outcomes.
Correlation Analysis
- Small Delegates (Correlation = −0.249): A moderate negative correlation indicates that increasing the share of small delegates meaningfully reduces concentration, enhancing decentralization.
- Whale Delegates (Correlation = +0.147): The weak positive relationship reflects that whale participation remained stable (~22 per proposal); additional whale power had limited effect on concentration.
- Mid-Tier Delegates (Correlation = −0.052): Correlation is statistically negligible, implying minimal influence of mid-tier participation on overall concentration.

Figure 7: Comparison of Gini Coefficient and Herfindahl-Hirschman Index (HHI) Over Time
Figure 7 plots the Gini coefficient (blue) and HHI (red) per proposal, illustrating the volatile dynamics of the Proposal Voting Layer. Both metrics remain exceptionally high (Gini ≈ 0.993–0.998) but move closely together, showing that inequality and concentration fluctuate in tandem rather than staying constant.
High Centralization Periods (Aug 2023, May 2024, Aug–Sep 2024): Sharp simultaneous spikes in Gini and HHI (up to ≈ 0.998 and ≈ 0.28, respectively) mark votes dominated by a few powerful blocs.
Broader Participation Periods (late 2023, mid-2025): Noticeable dips in both metrics indicate wider voter engagement and reduced dominance.
Recent Phase (mid-2025 onward): Both Gini and HHI reached their lowest levels, suggesting the most decentralized and equitable voting patterns in the DAO’s history—evidence that lower behavioral concentration can meaningfully reduce structural inequality.
Conclusion
The quantitative analysis of Arbitrum DAO’s governance reveals a system defined by a complex
dynamic: while governance power is structurally and persistently unequal, the concentration of that
power is dynamic and highly sensitive to delegate participation.
Our key findings from each layer are distinct but deeply related:
- 1. On the Delegated Voting Power Layer, a “Re-centralization” is Underway.
Our analysis of the delegated VP layer highlighted a critical divergence between metrics. We observed a “Redistribution Phase” in late 2023 where the HHI decreased—not because the system became more equal (Gini remained high), but because power spread among a larger group of competing whales. However, as small and mid-tier delegates began to exit through 2024-2025, this trend reversed. The system is now in a “Re-centralization Phase,” with HHI rising due to the decline of this “small mid-tier delegates.” - 2. On the Proposal (Actual) Layer, Participation is the Antidote.
In contrast, the proposal-level data provides a clear solution. Here, we found that Gini and HHI are positively correlated—when concentration (HHI) for a specific vote decreases, inequality (Gini) also measurably improves. Our analysis uncovered the key driver: the moderate negative correlation (-0.249) between HHI and small-delegate participation. This is a crucial insight: when small delegates show up to vote, they actively reduce concentration and improve decentralization.
The data demonstrates that Arbitrum’s governance is best understood as a system of dynamic concentration, rather than a fully decentralized collective. Its relative “health” and decentralization, therefore, are not best measured by equality, but by the degree of cooperation and balance among its largest delegates.
The primary challenge for the DAO is the one currently unfolding: the decline of the “small and mid-tier delegates.” As these delegates disengage, the system loses its most effective, data-proven counterbalance to power concentration, allowing the re-centralization we observed in the Delegated Layer. If this trend continues, Arbitrum DAO may move further toward centralization. To address this challenge, we suggest exploring mechanisms to support the delegate small mid-tier layer. This could include incentive frameworks that promote active participation from small and mid-tier delegates and/or incentive frameworks that encourage more delegation toward them. Strengthening this middle layer will be key to enhancing balance, sustaining participation, and maintaining a robust governance ecosystem.
You can access the full details of the research here: Quantifying Decentralization: Analysis of Voting Power in Arbitrum DAO